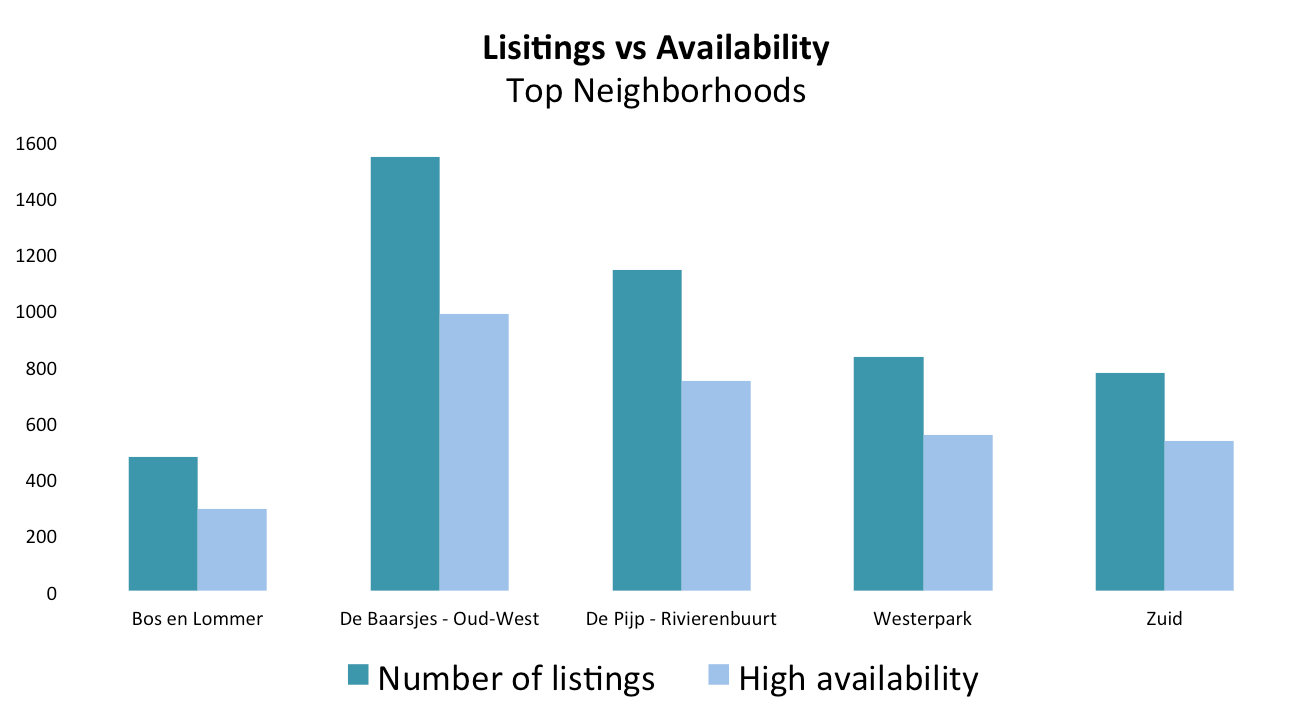


The data story compared neighborhoods in Amsterdam as potential Airbnb investment properties. Using small multiples in a progressive manner, I was able to break down complicated data into comprehensible segments.
Using small multiples to compare potential Airbnb investment properties.